VeracrossAnalyzer UI
A Website, A Visual Representation of Students' Grade Data on Veracross
Introduction Project Setup License
Introduction:
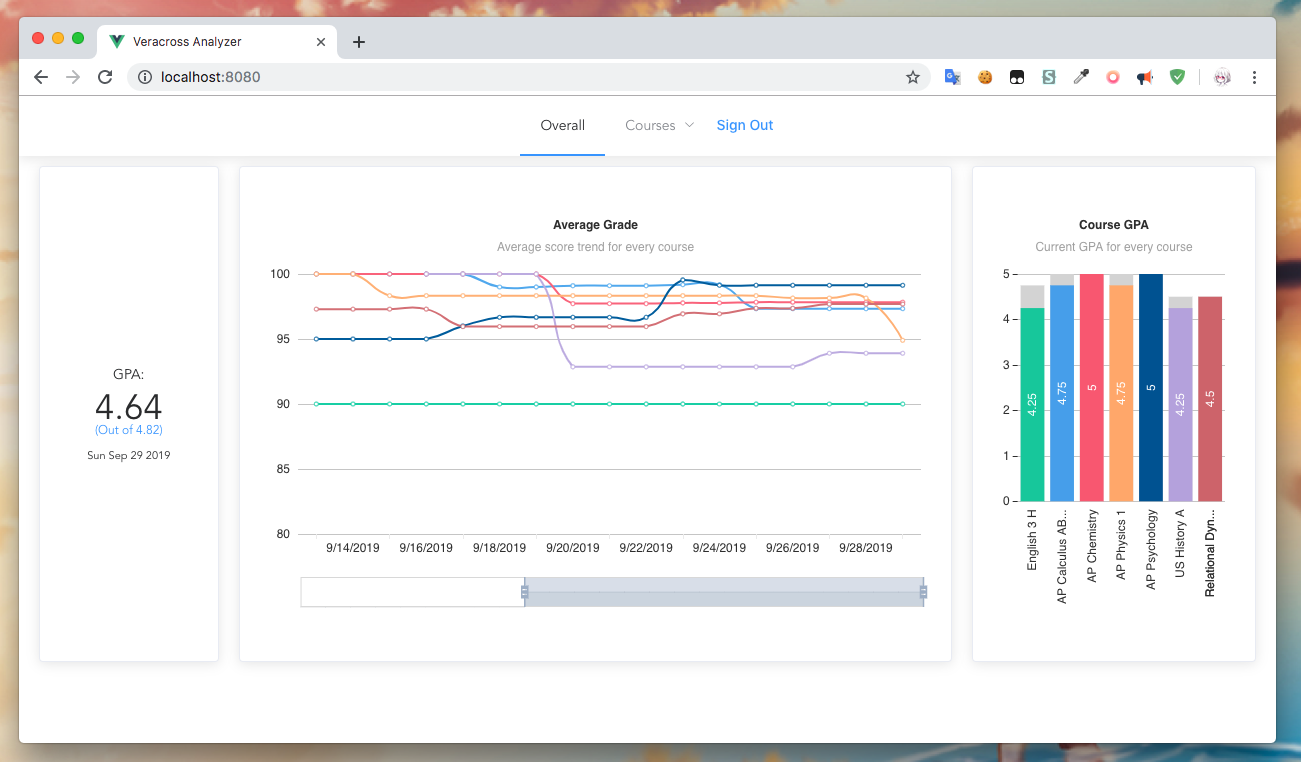
This is a website that generates visual representation of students' grade data on Veracross. Currently there is only one graph and one numerical data representing the GPA. But also it just released yesterday! (Yay!) What do you expect this soon lol?
Here's how it looks like right now: (Now all of you know my grades ;-;)
Project Setup:
TODO: Actually write a project setup tutorial that's not generated by Vue on initialization ;-;.
Install
npm install
Compiles and hot-reloads for development
npm run serve
Compiles and minifies for production
npm run build
License: MIT
The MIT license basically means that this project is open-soucred and you can do whatever you want with it, as long as you include a copy of this license in your distribution. You don't have to ask for permissions to use or anything. However, if you do bad things with it, I'm not responsible.